Geospatial Drone Solutions

Agricultural Drone Mapping in Missouri

Multispectral crop analysis, NDVI and NDRE vegetation maps, drainage topography, and field mapping for row-crop operations, agronomists, and cooperatives across eastern Missouri and Southern Illinois.

What You Receive

See the Whole Field Before You Walk It

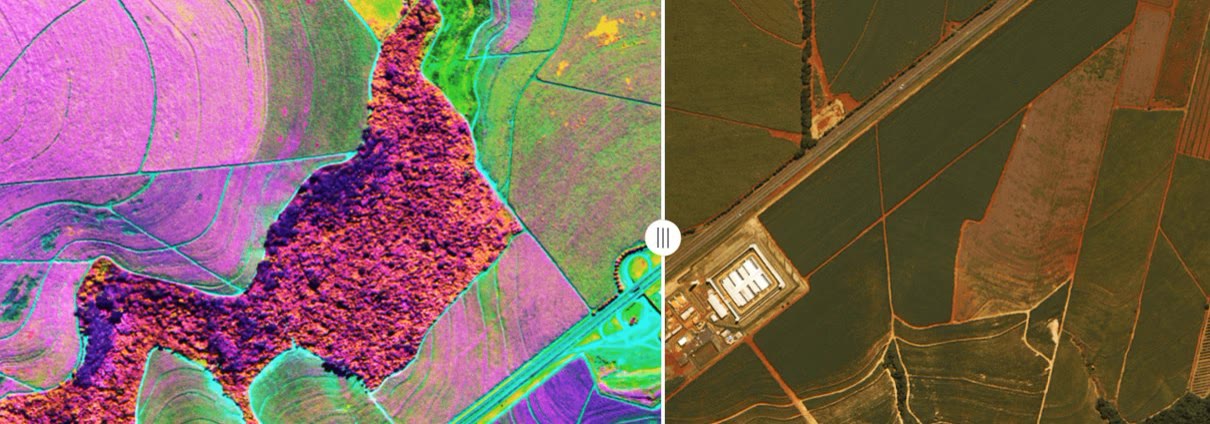
Healthy vegetation reflects strongly in the near-infrared and absorbs in the red; stressed vegetation does the opposite. A multispectral sensor records those bands separately, and the ratios between them, expressed as indices such as NDVI and NDRE, map plant vigor and chlorophyll status across an entire field at a resolution of a few centimeters per pixel. Variation that is invisible from the cab or the road edge, and blurred into a single pixel by satellite imagery, is resolved down to the row.

TerraSight flies multispectral and RGB sensors on DJI Enterprise platforms with a calibrated reflectance panel captured at every flight, so index values are comparable from field to field and from one date to the next rather than shifting with the light. Imagery is processed into georeferenced orthomosaics and index maps, then classified into management zones and scouting points delivered as shapefiles your agronomist can open in ArcGIS or QGIS or load into farm management and variable-rate systems.

Because the same aircraft carry LiDAR and photogrammetry payloads, an agricultural engagement can also produce the terrain data that drives tile drainage, surface drainage, and irrigation design: bare-earth DEMs, contours at the interval you specify, and flow-accumulation analysis across the field. Sensor details are on the technology page.

Standard Deliverables
NDVI Index Map (GeoTIFF) NDRE Index Map (GeoTIFF) Calibrated Multispectral Orthomosaic RGB Orthomosaic Management Zone Shapefile / KML Scouting Point File (SHP / KML) Bare-Earth DEM & Contour Map Drainage & Flow Analysis Point Cloud (LAS / LAZ) Field Summary Report (PDF)
Imaging Parameters
Imagery TypeMultispectral (incl. Red Edge, NIR) + RGB
CalibrationReflectance Panel, Each Flight
IndicesNDVI, NDRE, Others on Request
TerrainLiDAR or Photogrammetry DEM
Compatible WithArcGIS, QGIS, Farm Management & VRT Platforms
Applications

Four Ways Growers Use the Data

Multispectral imagery is a scouting and planning tool. It tells you where to look and how much of the field is affected, so agronomic decisions are made on measured extent rather than on the first few rows.

In-Season Crop Health & Stress Mapping

NDVI and NDRE maps flown during the growing season show vigor variation across corn, soybean, wheat, and specialty crops. Patterns that follow field geometry point toward equipment, application, or drainage causes; irregular patches point toward disease, pests, or soil variability. Each map is delivered with scouting points placed on the anomalies so the agronomist walks directly to them.

Repeat flights on a set interval build a time series that shows whether a problem is spreading, stable, or responding to treatment.

Stand Assessment & Replant Decisions

High-resolution RGB and multispectral imagery captured shortly after emergence reveals skips, doubles, washouts, and areas of poor emergence across the whole field at once. Delivered as an emergence map with affected acreage quantified by zone, it gives growers and insurers a documented basis for replant decisions and claims.

Where the crop and growth stage allow, plant counts are extracted from the imagery for sample areas and reported alongside the map.

Drainage & Irrigation Topography

Wet spots, ponding, and nutrient loss trace back to terrain. A bare-earth DEM and contour map from LiDAR or photogrammetry, combined with flow-accumulation analysis, show where water collects and where it leaves the field. This is the base data for tile drainage layout, surface drain and waterway design, and center-pivot or sub-surface drip planning.

Surfaces are delivered in formats compatible with Civil 3D and the design software used by drainage contractors and engineers.

Field Boundaries, Conservation & Land Management

Georeferenced orthomosaics provide accurate field boundaries, acreage, waterway and buffer extents, terrace locations, and documentation of conservation practices for program compliance. For land managers and lessors, a dated orthomosaic is an objective record of land condition at the start and end of a lease.

Boundaries and features are delivered as shapefiles and KML for GIS, FSA mapping, and farm management platforms.

Who It Serves

Growers & Advisors Across Missouri & Illinois

Row-Crop Farms

Corn, soybean, and wheat operations in the Missouri and Mississippi river bottoms and upland fields of eastern Missouri and Southern Illinois.

Agronomists & Crop Consultants

Calibrated index maps and scouting points that make field visits more targeted and give recommendations a documented spatial basis.

Cooperatives & Ag Retailers

Imagery programs offered across member and customer acreage, with zone files that feed variable-rate fertility and seeding prescriptions.

Drainage & Irrigation Designers

Bare-earth terrain, contours, and flow analysis for tile layout, surface drainage, waterways, and irrigation system planning.

Land Managers & Farmland Owners

Dated, georeferenced records of field condition, boundaries, and conservation practices for leases, acquisitions, and program compliance.

Research Plots & Seed Trials

Consistent, calibrated multispectral capture across trial blocks for plot-level comparison through the season.

How It Works

Capture. Process. Deliver.

Multispectral data is only comparable when capture conditions and calibration are controlled. Every flight follows the same procedure so maps from June and maps from August mean the same thing.

01
Field Review & Program Plan

We review field boundaries, crops, growth stages, and the decisions the data needs to support, then define the flight interval, indices, zone count, and output formats with you or your agronomist. Boundaries are loaded from your existing shapefiles where available.

02
Scheduling for Light & Growth Stage

Flights are scheduled within a consistent window around solar noon under stable sky conditions, and timed to the growth stage that answers the question at hand. If conditions on the day would compromise calibration, we reschedule rather than deliver maps that cannot be compared to the last set.

03
Multispectral & RGB Capture

An FAA Part 107 licensed, professionally trained pilot flies the fields with multispectral and RGB sensors recording together, capturing the reflectance panel before and after each flight. Where terrain data is in scope, a LiDAR or photogrammetry pass is flown in the same visit.

04
Calibration, Indices & Zoning

Imagery is radiometrically calibrated, stitched into orthomosaics, and processed into NDVI, NDRE, and any additional indices requested. Index maps are classified into management zones, anomalies are flagged as scouting points, and terrain data is processed into DEMs, contours, and flow analysis.

05
Delivery & Season Archive

You receive the index maps, orthomosaics, zone and scouting files, terrain products, and a field summary report in the formats your software accepts. Each flight is archived against the same boundaries and calibration so the season builds into a comparable record.

Why TerraSight

Calibrated Data, Not Just a Colorful Map

An NDVI map that is not radiometrically calibrated is a snapshot of that afternoon's light as much as of the crop. TerraSight captures a reflectance panel on every flight and processes imagery through the same professional photogrammetry software used for engineering work, so index values hold their meaning across dates and across fields. That is what makes a time series useful and a zone file trustworthy as the basis for a prescription.

We are based in O'Fallon, Missouri, close to the river-bottom and upland cropland of St. Charles, Lincoln, Warren, and Franklin counties and the Illinois counties of the Metro East, which makes in-season repeat flights practical. Our pilots are FAA Part 107 licensed and professionally trained, and our operations are fully insured.

We provide the data; agronomic interpretation stays with you and your advisors. Where a farm or agribusiness also needs topographic mapping for drainage design, commodity pile volumes at the elevator, or thermal inspection of irrigation and electrical equipment, those are delivered from the same sensors and the same visit. More on our equipment is on the technology page.

  • Reflectance-panel calibration on every flight for comparable index values
  • NDVI and NDRE delivered together, with additional indices on request
  • Centimeter-scale resolution that resolves row-level variation
  • Management zones and scouting points as shapefiles for GIS and VRT systems
  • Bare-earth terrain and flow analysis for drainage and irrigation design
  • Flights scheduled to light conditions and growth stage, not convenience
  • Season-long archive processed against the same boundaries and calibration
  • FAA Part 107 licensed pilots, fully insured operations
Questions

Agricultural Drone Mapping FAQ

What is the difference between NDVI and NDRE?

Both are vegetation indices computed from multispectral bands. NDVI compares near-infrared reflectance to red and is a reliable indicator of overall vigor and canopy cover, but it saturates once the canopy closes. NDRE substitutes the red-edge band for red and remains sensitive to chlorophyll and nitrogen status in dense, mature canopies. Early in the season NDVI is usually the more useful map; later in the season NDRE often shows variation that NDVI no longer resolves. We deliver both so your agronomist can choose.

How does drone multispectral imagery compare to satellite imagery?

Satellite products are inexpensive and frequent but are limited by cloud cover and by pixel sizes measured in meters, which blur row-level and plant-level variation. Drone multispectral imagery is captured below the clouds on the day you need it, at centimeter-scale resolution, and with radiometric calibration tied to a reflectance panel. For whole-farm trend monitoring satellite data is often sufficient; for diagnosing a specific field or validating a management decision, drone data shows what the satellite cannot.

Can you tell me what is wrong with my crop from the imagery?

The imagery shows where the crop is stressed and how severely, and it does so across the whole field at once. It does not by itself identify the cause. Nutrient deficiency, compaction, disease, insect pressure, herbicide injury, and drainage problems can all produce similar patterns. Our maps direct scouting to the right locations; confirming the cause is work for you, your agronomist, or your crop consultant in the field.

Can the maps be loaded into my farm management software or sprayer?

Yes. Index maps are delivered as georeferenced GeoTIFFs, and management zones or scouting points are delivered as shapefiles and KML. These open in ArcGIS and QGIS and import into common farm management platforms and variable-rate controllers that accept shapefile prescriptions. We can match your preferred zone count and coordinate system.

Where do you provide agricultural drone mapping?

TerraSight is based in O'Fallon, Missouri and provides agricultural drone mapping and multispectral imaging across eastern Missouri and Southern Illinois, including farms in St. Charles, Lincoln, Warren, and Franklin counties and the Illinois counties of the Metro East. Larger operations and multi-farm programs elsewhere in Missouri and Illinois can be scheduled by arrangement.

Related Services

More From the Same Site Visit

Mapping Fields in Missouri or Southern Illinois?
Tell us about the operation, the crops, and the decisions you need the data to support. We will propose an imaging program for the season.
Request a Consultation